How many times have you been stuck on a difficult problem that required lots of debugging? Hours go by and you make incremental progress on the solution. Finally, eureka, you’ve cracked it. On to the pull request! To your dismay it gets shot down immediately because of this
print_r($some_var);
or this
console.log(some_var);
or, science forbid, this
alert(some_var);
What if I told you you were doing it wrong?
Let’s do it right
Print statements are a very simple way to debug your code. They’re great, if I need something quick I’ll still drop one in. I’ll even remember to remove them later, usually… Their biggest drawback though is that they limit your view into what’s actually going on in your program, both in the variables that you’ve printed and how the program flows before and after your print statement.
If you want to really understand what’s going on in your program at a given point in time you need to be using a step-through debugger. Step-through debuggers are commonplace among compiled languages but for whatever reason in web development, at least in my experience, they haven’t seemed to catch on. This needs to change.
Why, you ask? Let’s look at how a step-through debugger works. A debugger attaches itself to the program’s process and listens for events. If your program isn’t throwing any exceptions or forcing any breakpoints the program will execute as normal.
There are some common features of step-through debuggers which I’ll be referencing in the rest of this blog post, here’s a list:
- Breakpoint – A line number of interest in your program. When the debugger is running it halts execution of the program at this line.

- Call stack – A list of functions in the debugger that explains how the program got to where it currently is. Think of this as a live stack trace, without the exception.
- Continue – An action to take in the debugger that will continue execution until the next breakpoint is reached or the program exits.

- Step over – An action to take in the debugger that will step over a given line. If the line contains a function the function will be executed and the result returned without debugging each line.

- Step into – An action to take in the debugger. If the line does not contain a function it behaves the same as “step over” but if it does the debugger will enter the called function and continue line-by-line debugging there.

- Step out – An action to take in the debugger that returns to the line where the current function was called.

Breakpoints are the key though, consider this (contrived) example:
/**
 * Returns an array of random numbers up to *size*.
 *
 * @param {int} size
 *   The size of the random array to return.
 *
 * @return {array}
 *   Array of random integers.
 */
function loop(size) {
  var ary = []
  var min = 0;
  for (var max = 1; max <= size; max++) {
    var rand = Math.floor(Math.random() * (max - min + 1) + min)
    ary.push(rand);
  }
  return ary;
}

var max = 100;
var min = 1;
var size = Math.floor(Math.random() * (max - min + 1) + min);

var res = loop(size);
console.log('Created an array with ' + res.length + ' results.');
console.log(res.join(', '));
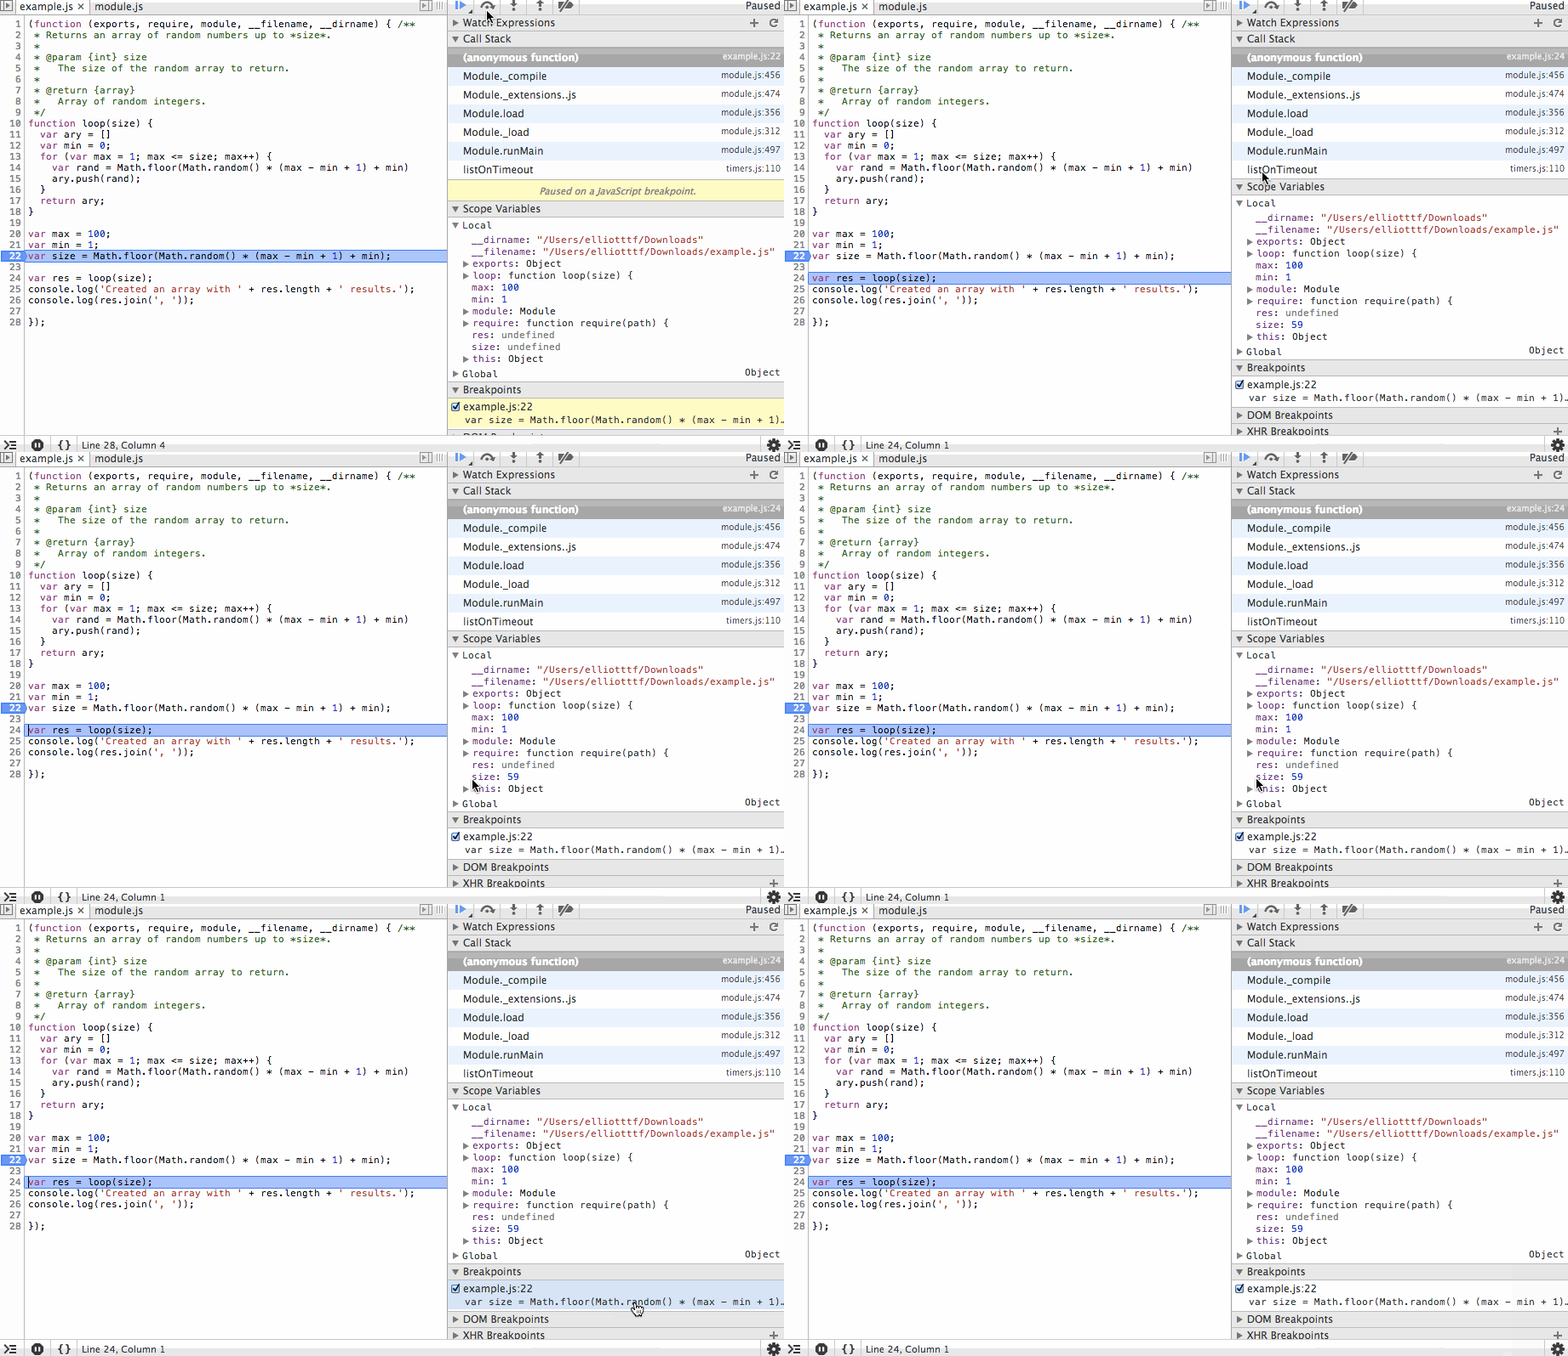
Suppose we’re interested in the value of size before we enter the loop function. Sure we could print there, but what if we’re also interested in what happens after the value is created? Using a step-through debugger we can follow the execution path of the program and track our variable – and any other in-scope variables – as the program is running. It’s easier to show this than to write about it, so check this out:
We’ll start by adding a breakpoint at line 21 (22 in the debugger since node-inspector wraps our code in an IIFE). When the program is started it will immediately pause at this line. The first action we’ll take is to step over this line so the value is instantiated. In the debugger you’ll see that the size variable is listed with the value 78.

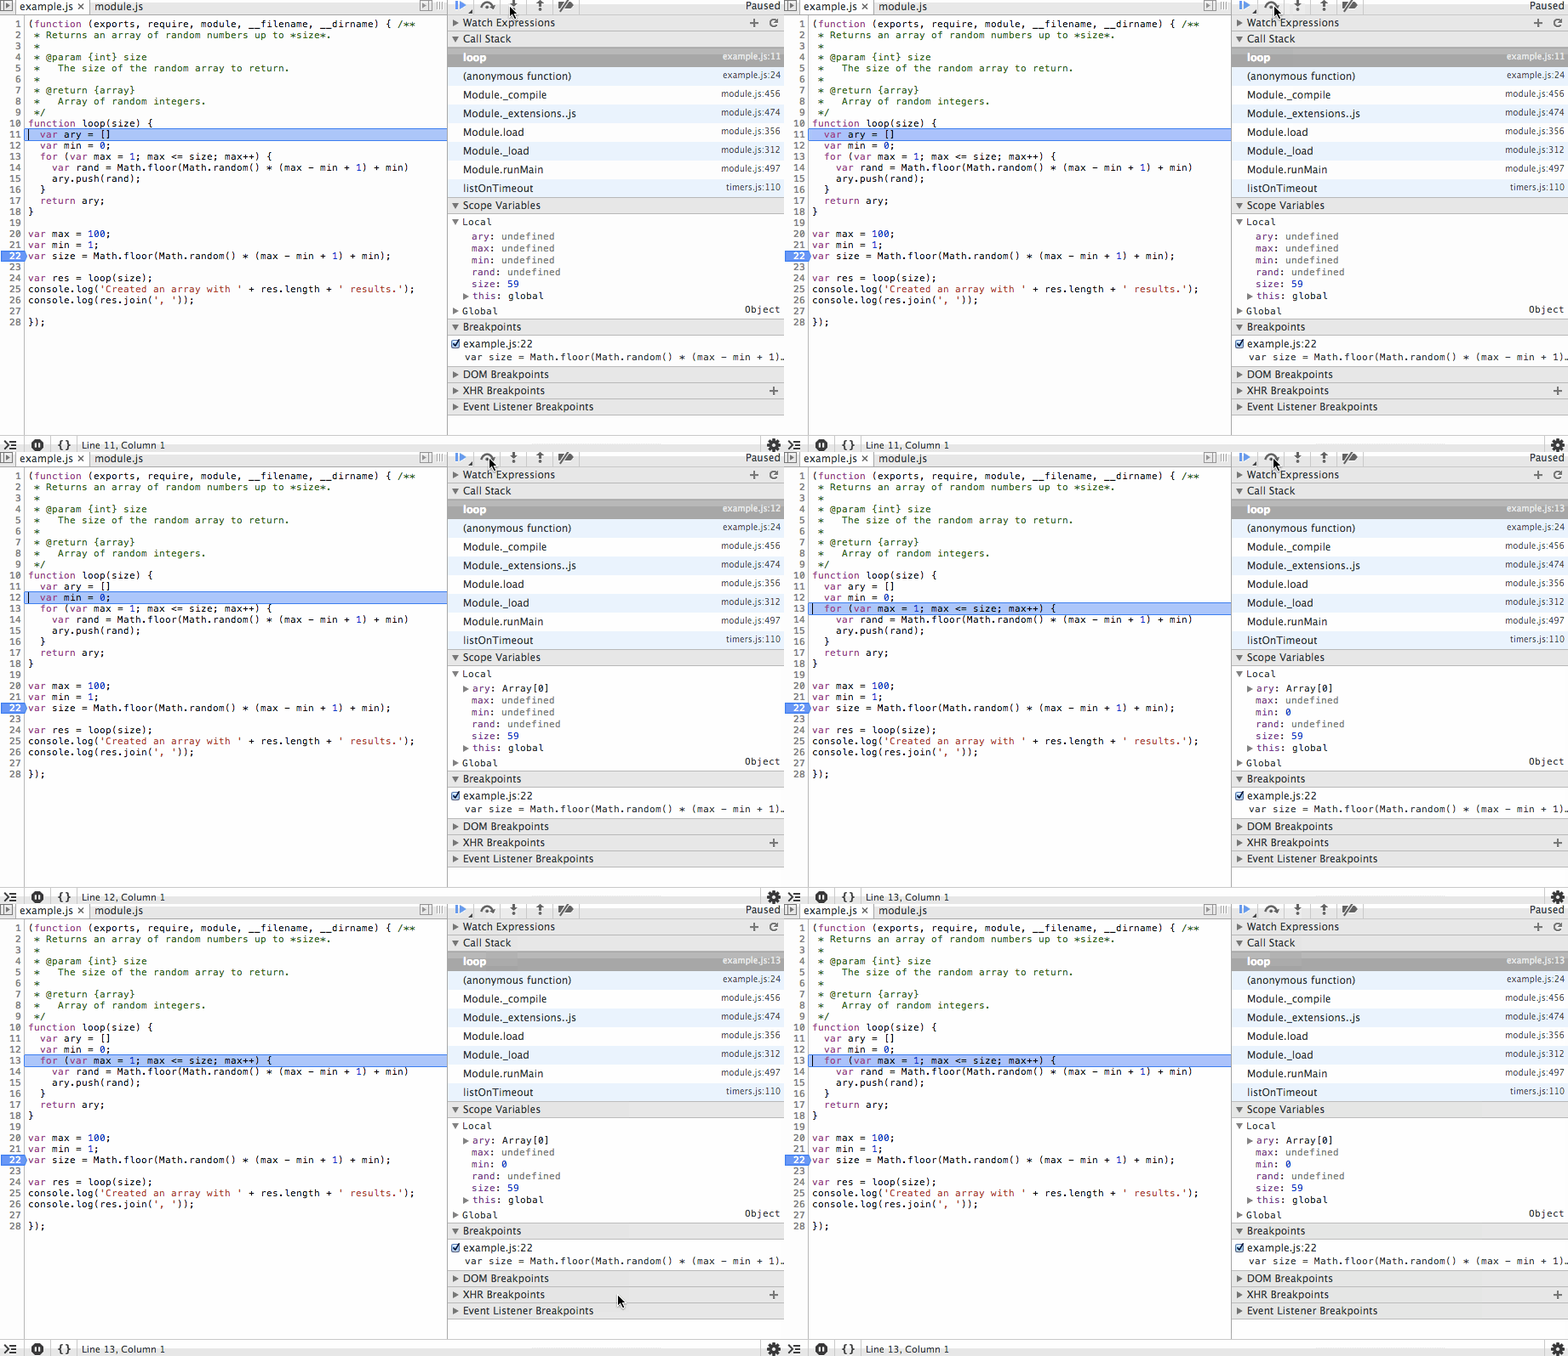
The next action we’ll take is to step into the loop function and step over the ary and min variable instantiations. You’ll see the initial values being set in the scope variables list as we step over each line.

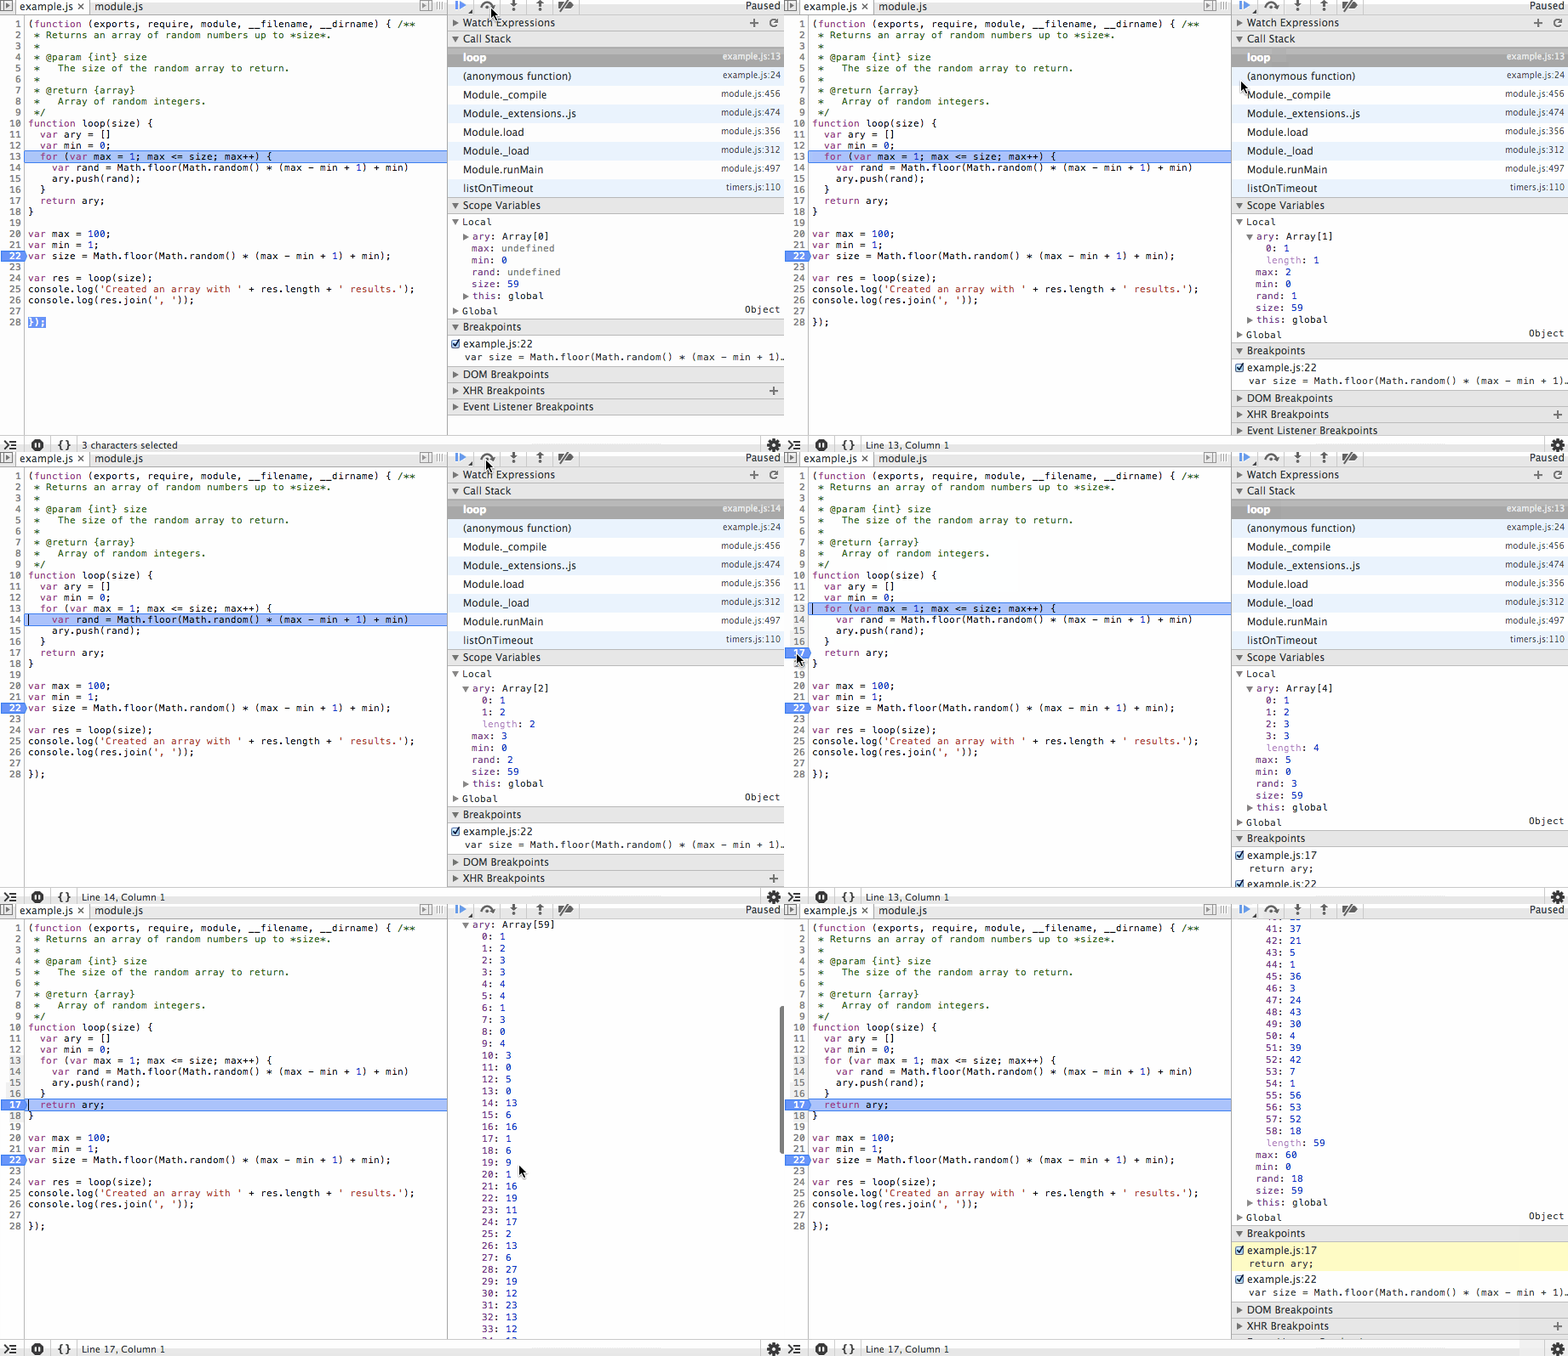
Next we’ll step through the for loop. You’ll notice the ary array is growing with random values and that on each step we can see the value of rand before it is appended to the array. We’ll add a new breakpoint at the end of the array and continue to that point so we don’t have to step through each iteration of the loop.

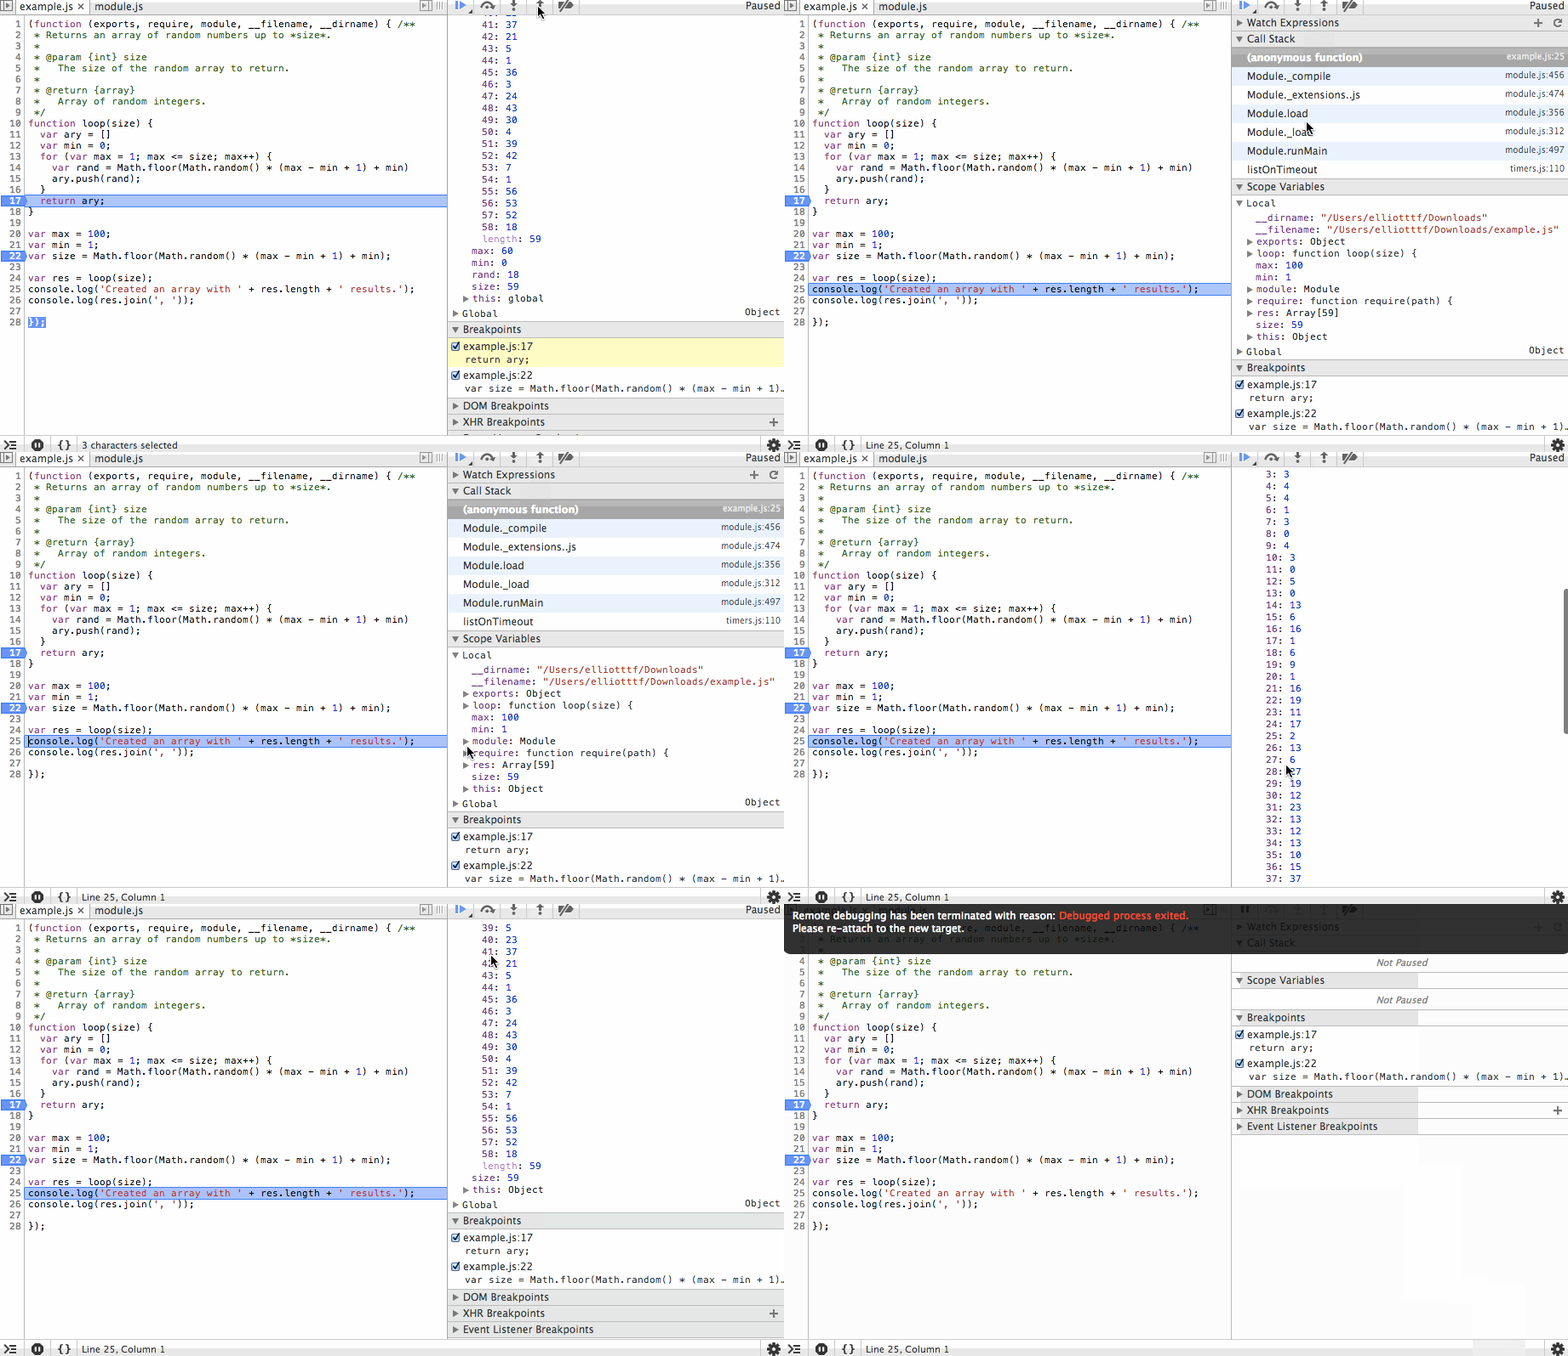
Finally we’ll step back out, in this case stepping over or in would produce the same result since we’ve reached the end of the function, but why not go ahead and use our one remaining action? After we review the results we’ll continue to the end. The process that the debugger is connected to will exit cleanly and the debugging session will end.

This is obviously a very simple example of how a step-through debugger works but hopefully it’s clear how powerful this can be.
To take this one step further, when you start dealing with nested function calls the call stack list will display the current function you are executing and the functions that were called to get you here. You can step back out to any one of those functions and observe the scope of variables, etc that existed when the function was called. So now not only can you get a snapshot of where things are currently and where they are going, you can also see what things looked like in the past that led the program here. This is huge for debugging complex code or just learning how someone else’s code works!
Ok, I’m sold, now what?
There are two major components for step-through debugging that are common regardless of what type of code you’re debugging:
- A process that is sending debug information.
- A debugger that is listening for debug information.
Typically you start a process for debugging by adding some conditional flags. I’ll cover the programming languages we work with the most at Four Kitchens here, but the process is going to be the same for pretty much everything.
For PHP you need to install xdebug on your server and add a xdebug.ini config file like this:
 zend_extension=/usr/lib/php5/20090626/xdebug.so
 xdebug.remote_enable=1
 xdebug.remote_host=10.1.0.1
 xdebug.remote_port=9000
 xdebug.remote_autostart=1
The config variables are described in detail in the xdebug documentaion so I won’t go into them here, but take note of the remote_port and remote_autostart variables. These tell PHP to send debug info to port 9000 and to begin in “debug mode” as soon as a PHP process starts.
Similarly, in node.js you can start a process in debug mode as follows:
node --debug app.js
or
node --debug-brk app.js
to halt on the first line of your script.
The next step is configuring the debugger. If you use an IDE like eclipse this is often baked in. Since – according to my fellow web chefs – I’m a vim using masochist, I use stand-alone debuggers for PHP MacGDBP and node.js node-inspector. MacGDBP isn’t the best debugger I’ve ever used but it gets the job done. Node-inspector is a great tool and because its interface is chrome dev tools it’s very familiar. If you’re not using dev tools node-inspector is a great segue into using them. (If you’re not using chrome dev tools or similar for step-through debugging your front end JavaScript, guess what… you’re doing that wrong too!)
You’ll need to match the debugger’s port up with whatever your process is running with: 9000 in our PHP example and 5858 for node.js by default.
After that’s configured you should be all set to start stepping through your code and will never be burdened by cleaning up debug print statements again! I can’t tell you how much time I’ve saved by doing all of my debugging this way. Simple problems like misspelled variables or minor logic issues literally pop out at you when you’re stepping through. Obscure pieces of code that you wrote months ago come back to haunt you in minutes, not hours. The code you write is more robust all around. I hope you found this post useful and will kick print statements and start stepping through your code!
Making the web a better place to teach, learn, and advocate starts here...
When you subscribe to our newsletter!
* indicates required field
