Last week, I covered the first set of Google Analytics myths that just won’t die. This week, we’ll pick up the conversation with the second group of commonly held misconceptions about Google Analytics.
Myth #6: Most of our users are on desktop. We should focus more of our marketing there.
This is only a circumstantial myth. It’s absolutely true that you can use analytics gain valuable insights into how different segments your traffic behaves on your site (whether segmenting by technology, region, behavior, etc.). But be careful that the tail isn’t wagging the dog with what you do with that information.
If you run a lot of marketing you might have certain campaigns explicitly or implicitly targeting different demographics. Maybe you’re running a campaign that only shows up in apps on mobile. Well, naturally you’re going to see an increase in the share of traffic to your site showing up on mobile. If you use that knowledge to then focus more targeting on mobile you’ve just created a feedback loop.
When considering site behavior and where you should focus future efforts, be careful to exclude traffic that you’ve targeted and brought to your site.
Tip: create a segment of all non-camapign sources of traffic to your site (usually: organic, referral, and direct) to get a feel for how free sources are performing.
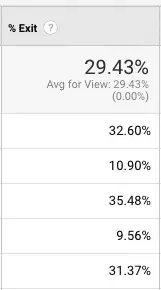
Myth #7: A high exit % on a page is a sign of a problem.

Not in the least! Every single session ends eventually. You want to make sure they’re exiting on the right pages. Simply ask yourself: is this the last page that I want my users to be seeing? Perhaps the page is encouraging some type of offline communication. Or maybe the user got exactly the information they came to find. Maybe they even converted (form submission thank-you pages often have high exit rates).
- Bad exit page: /free-trial-signup
- Good exit page: /thanks-for-signing-up
Myth#8: Analytics data is never going to be perfect, therefore there’s no point in paying much attention to it.
First, it’s true that your analytics numbers will never be perfect. A few ad-blockers and certain privacy-focused javascript blockers prevent analytics data from firing.
Also, if the same user visits your site on their desktop before picking up their phone and returning, Google sees that as two users.
Many years ago I was a young boy and was wandering around a store when I noticed that there was an infrared counter at the entrance. When the invisible beam across the front door was interrupted, the counter ticked up. I figured that it was counting traffic into the store by how many people went through. Perhaps the store had some sort of metric that calculated percentage of users who make a purchase or total traffic by day. And yet, if a 10-year-old sees that and waves his hand in front of it ten times, it skews the numbers. The store has two options–throw out all of that information because it will never be exact. Or, focus on the broader trends and averages over time, making that monetary blip one afternoon completely inconsequential.
Your website analytics are the same way. If you’re caught up in the futile endeavor for complete precision, you’ll never have any time to find all of the actionable pieces of information that are ready and waiting for you! Don’t let perfect be the enemy of good. Focus less on the specific numbers and more on the larger trends and changes over time. That’s where the real value and insights lie.
Myth #9: Average Session Duration shows how long the average user spent on my site.
It’s quite understandable to think that! But, out of the box, GA will always underestimate values for Average Session Duration.
Why? It has to do with the ways that GA receives information. Every interaction with GA comes along with a timestamp. When a first pageview is sent to GA, Google has a timestamp telling exactly when that pageview happened. If the user spends 30 seconds on the page and then clicks a link to a second page, that second pageview request brings along another timestamp. By taking the delta of the two timestamps, Google now knows how long the user was on the first page.
A session will continue in this manner until the final pageview of a session. What happens at that point? If the user spends three minutes on the final page and then closes their browser, there’s no final interaction with GA so they don’t know how long the user was on that page and that pageview registers as zero seconds for the sake of session duration.
But do not fret, this is a perfect time to re-read Myth #8. There are still valuable insights to be gained by comparing session duration metrics between different segments or campaigns. Just focus on the trends and changes and don’t worry as much about the precise numbers!
Do you have more questions about your Google Analytics? I’d love to talk about it. Grab a spot on my calendar!
Making the web a better place to teach, learn, and advocate starts here...
When you subscribe to our newsletter!
